Analytics and Visualizations
HeapCraft contains powerful tools for visualizing the activity on Minecraft servers. Admins have access to live analytics and visualizations over the HeapCraft Dashboard as soon as they install Epilog. Check out the demo dashboard for a preview of the currently available content. More visualizations will be available in the near future. We will make the visualization scripts available in the future so you can improve them or create your own.
Examples

number of online players over seven days

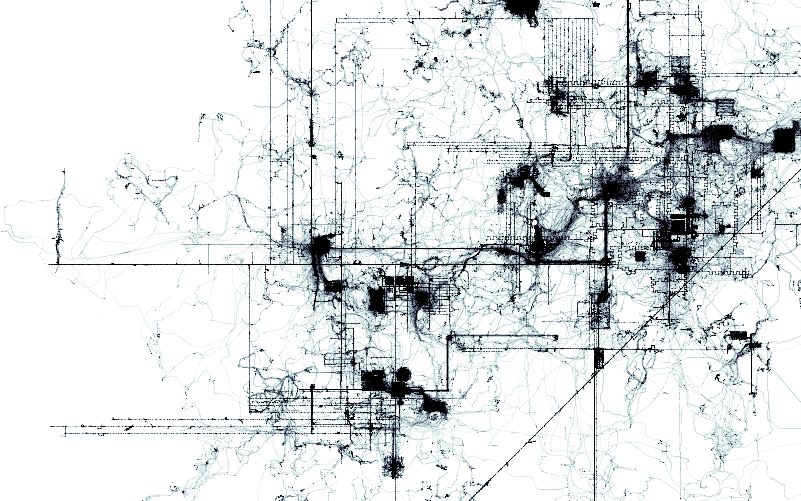
accumulated player positions over time; logarithmically

some calculated player metrics
Previous projects
We collected 14 days worth of gameplay on our legacy server between July 13 and September 12 2014. The collection process and some preliminary data analysis are discussed in a thesis written by Stephan Müller.
Our previous work is summarized in this video: