Visualizations
MapMiner
The MapMiner tool enables interactive exploration of player position over time. A timeline shows the number of active players on a server, while the map shows the position of those players over the selected time period. The map can be zoomed and moved interactively and updates continuously while selecting or moving the time frame.
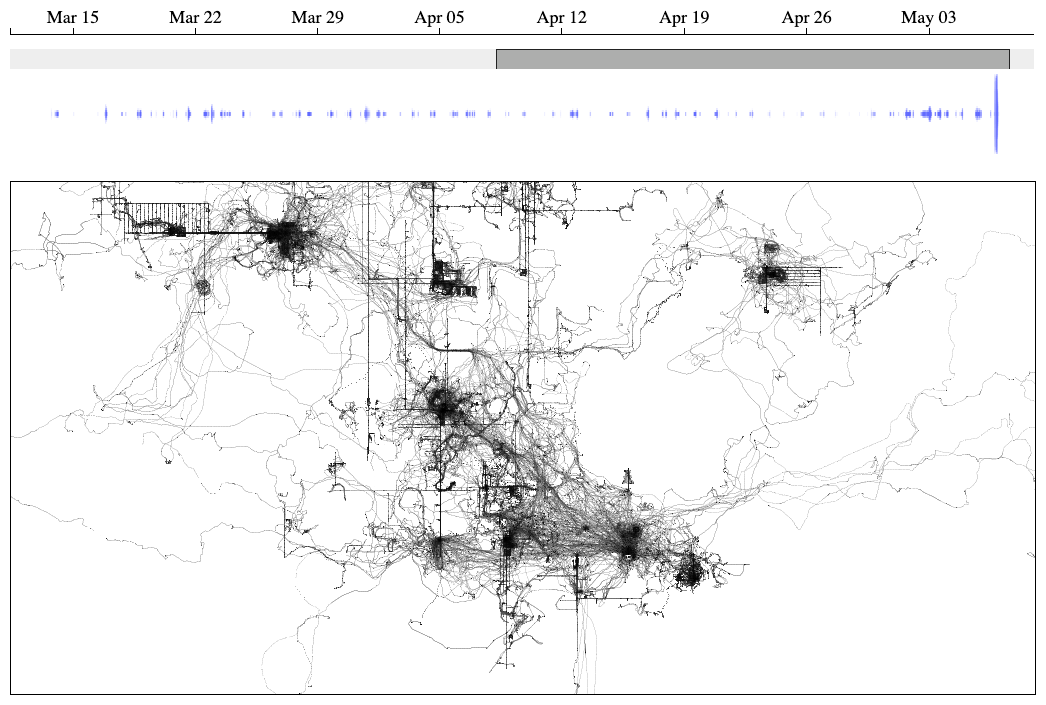
Source code and documentation can be found on GitHub. We also host interactive demos with data derived from recorded gameplay: demo1 (3.4MB), demo2 (18.8MB). The demos might take a few seconds to load.
GraphMiner
The GraphMiner tool enables interactive exploration of player relationships represented by weighted graphs. Multiple graphs can be visualized simultaneously. JavaScript expressions are used to sort and filter players (vertices) and relationships (edges).
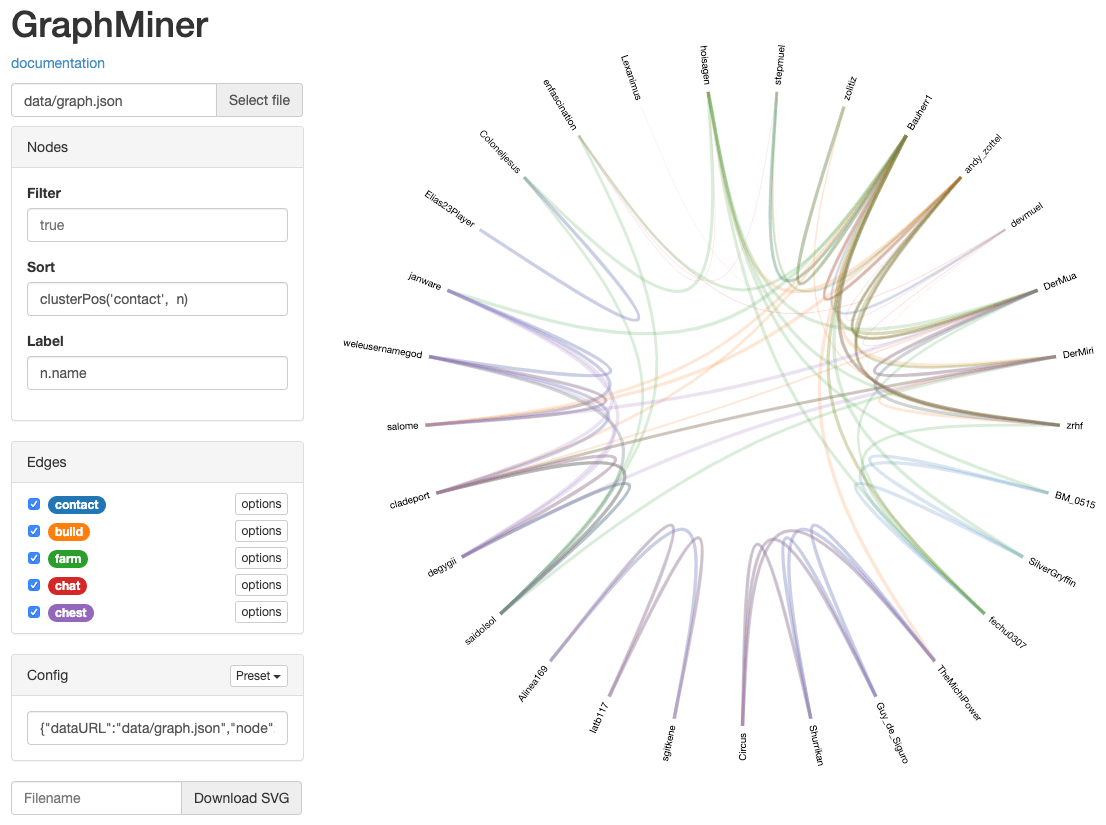
Source code and documentation can be found on GitHub. We also host interactive demos with data derived from recorded gameplay: demo1, demo2.
Map Exploration Time Lapse
Using our Epilog plugin, we collected 14 days worth of gameplay on a Minecraft server between July 13 and September 12, 2014. The video shows how the players explore a new world. Regions get darker the more time players spend there. Underground mine shafts can be identified by dark, straight lines. Exploring on the surface creates bright lines. One frame represents 5 minutes and the video shows 60 frames per second. Periods without player activity are skipped.